
Quantzig, a global data analytics and advisory firm, that delivers actionable analytics solutions to resolve complex business problems has announced the completion of its latest success story that explains how the adoption of data visualization best practices enabled a financial services provider to leverage a data-driven business culture that enabled them to enhance BI capabilities and drive the business forward.
This press release features multimedia. View the full release here: https://www.businesswire.com/news/home/20191211005296/en/
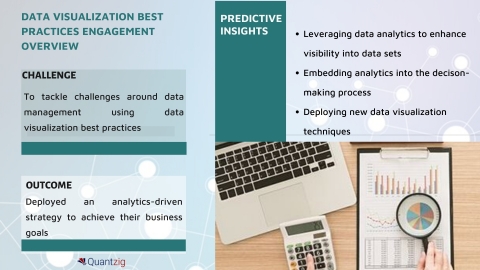
DATA VISUALIZATION BEST PRACTICES ENGAGEMENT OVERVIEW (Graphic: Business Wire)
In today’s big data era, there are several opportunities for banking services providers to save big by analyzing the data they possess. However, when it comes to data visualization and analysis, banking firms often find it difficult to find value in their analytics investments. In this scenario, a German financial services provider approached Quantzig seeking to leverage its analytics expertise to implement data visualization best practices to tackle such issues.
Leveraging analytics tools, investing in adequate data management infrastructure, and hiring professionals to manage the database is quite challenging. Request a FREE proposal to learn how data visualization best practices can help!
The Data Visualization Challenges Faced by the Financial Services Provider Included:
• A disconnected data management system that brought in several barriers and hampered their ability to innovate
• A debilitating disconnect between the data visualization techniques and the key decision-makers
• A siloed data management system that curtailed their ability to draw conclusive insights using data
We help businesses identify the optimal price for their products and services to drive conversions and improve MROI. Contact our analytics experts for more insights.
The data visualization engagement comprised of three phases:
Phase 1: In the first phase, we conducted an in-depth analysis of the business data by gathering and analyzing them to extract maximum insights.
Phase 2: The second phase of this data visualization best practices engagement revolved around leveraging data visualization techniques to discern patterns in the extracted datasets.
Phase 3: The final phase revolved around the creation of data visualization charts to enhance the transparency of the risk management process, empowering the client to analyze assets and better understand idiosyncratic risk factors.
Despite the technical challenges of extracting insights from disparate data sets, data visualization best practices promise to transform the financial services ecosystem. Request a free demo to get started!
The use of data visualization best practices enabled the client to:
- Gain better visibility into data sets
- Devise an analytics-driven strategy to achieve their revenue and business goals
- Analyze assets and better understand idiosyncratic risk factors using new data visualization techniques
- Read the complete success story for comprehensive insights: http://bit.ly/2E2W7F7
The benefits offered by data visualization best practices are comprehensive and widespread. Wonder what they are? Request more information from our experts!
About Quantzig
Quantzig is a global analytics and advisory firm with offices in the US, UK, Canada, China, and India. For more than 15 years, we have assisted our clients across the globe with end-to-end data modeling capabilities to leverage analytics for prudent decision making. Today, our firm consists of 120+ clients, including 45 Fortune 500 companies. For more information on our engagement policies and pricing plans, visit: https://www.quantzig.com/request-for-proposal

View source version on businesswire.com: https://www.businesswire.com/news/home/20191211005296/en/