
HouseCanary, Inc. (“HouseCanary”), a leading provider of residential real estate data and home valuations, today released its latest Market Pulse report, covering 22 listing-derived metrics and comparing data between the week ending July 31, 2020 and the week ending March 13, 2020. The Market Pulse is an ongoing review of proprietary data and insights from HouseCanary’s nationwide platform.
This press release features multimedia. View the full release here: https://www.businesswire.com/news/home/20200806005348/en/
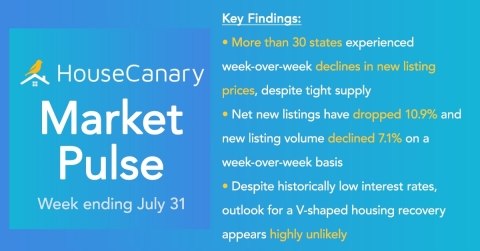
HouseCanary Market Pulse Report (Graphic: Business Wire)
Jeremy Sicklick, Co-founder and Chief Executive Officer of HouseCanary, commented: “Some cracks in the housing market are beginning to surface now that new listing prices are dropping across more than 30 states – even as supply constraints grow more pronounced. The supply-demand imbalance is also continuing to worsen as net new listings and weekly new listing volume have fallen to their lowest levels since late April. These cracks are only being exacerbated by the impending second wave of infections and shutdowns across the country, as well as uncertainty surrounding Congress’ ability to pass a stimulus package that would prop up the broader economy. As we move into August and the remainder of 2020, it will be important to closely monitor the behavior fluctuations of buyers and sellers and their impact on housing prices.”
Select findings from this week’s Market Pulse are below. Be sure to review the Market Pulse in full for extensive state-level data.
Total Net New Listings:
- Since the week ending March 13, there have been 1,208,083 net new listings placed on the market, representing a 16.8% decrease relative to the same period in 2019
- For the week ending July 31, there were 51,234 net new listings placed on the market, representing a 10.9% decrease compared to the previous week
- This is the lowest weekly level of net new listings observed since early May
-
Percentage of total net new listings since March 13, broken down by home price:
- $0-$200k: 22.5%
- $200k-$400k: 44.9%
- $400k-$600k: 17.7%
- $600k-$1mm: 10.0%
- >$1mm: 4.9%
Weekly New Listing Volume (Single-Family Detached Homes):
- New listing volume is down 7.1% week-over-week
- New listing volume is down 24.2% nationwide compared to the week ending March 13, when most COVID-19 measures were implemented
-
Decline in new listing activity since the week ending March 13, broken down by home price:
- $0-$200k: (-26.7%)
- $200k-$400k: (-26.3%)
- $400k-$600k: (-22.9%)
- $600k-$1mm: (-18.6%)
- >$1mm: (-13.1%)
Median Listing Price Activity (Single-Family Detached Homes):
-
31 states experienced a week-over-week decline in the median price of newly listed properties
-
The most significant week-over-week new listing price declines include:
- West Virginia: (-4.6%)
- Connecticut: (-3.7%)
- Kansas: (-2.8%)
-
The most significant week-over-week new listing price declines include:
Weekly Contract Volume (Single-Family Detached Homes):
- Weekly contract volume is down 7.4% week-over-week
-
Percent change in contract volume week-over-week, broken down by home price:
- $0-$200k: (-7.4%)
- $200k-$400k: (-7.1%)
- $400k-$600k: (-8.5%)
- $600k-$1mm: (-6.9%)
- >$1mm: (-6.2%)
- Weekly contract volume is up 16.1% nationwide compared to the week ending March 13, when most COVID-19 measures were implemented
-
Percent change in weekly contract volume since the week ending March 13, broken down by home price:
- $0-$200k: +0.8%
- $200k-$400k: +13.4%
- $400k-$600k: +25.0%
- $600k-$1mm: +42.8%
- >$1mm: +53.3%
Total Listings Under Contract:
- Since the week ending March 13, 1,373,088 properties have gone into contract across 41 states, representing a 1.7% decrease relative to the same period in 2019
- For the week ending July 31, there were 73,519 listings that went under contract nationwide
-
Percentage of total contract volume since the week ending March 13, broken down by home price:
- $0-$200k: 24.5%
- $200k-$400k: 45.3%
- $400k-$600k: 17.0%
- $600k-$1mm: 9.1%
- >$1mm: 4.1%
As a nationwide real estate broker, HouseCanary’s broad multiple listing service (“MLS”) participation allows us to evaluate listing data and aggregate the number of new listings as well as the number of new listings going into contract for all single-family detached homes observed in the HouseCanary database. Using this data, HouseCanary continues to track listing volume, new listings, and median list price for 41 states and 50 individual Metropolitan Statistical Areas (“MSAs”).
About HouseCanary:
Founded in 2013, valuation-focused real estate brokerage HouseCanary provides software and services to reshape the real estate marketplace. Financial institutions, investors, lenders, mortgage investors, and consumers turn to HouseCanary for industry-leading valuations, forecasts, and transaction-support tools. These clients trust HouseCanary to fuel acquisition, underwriting, portfolio management, and more. Learn more at www.housecanary.com.

View source version on businesswire.com: https://www.businesswire.com/news/home/20200806005348/en/