
Nutanix,
Inc. (NASDAQ: NTNX),
a leader in enterprise cloud computing, today announced financial
results for its third quarter of fiscal 2019, ended April 30, 2019.
This press release features multimedia. View the full release here:
https://www.businesswire.com/news/home/20190530005740/en/
Nutanix Fiscal Q3 2019 Earnings Infographic (Graphic: Business Wire)
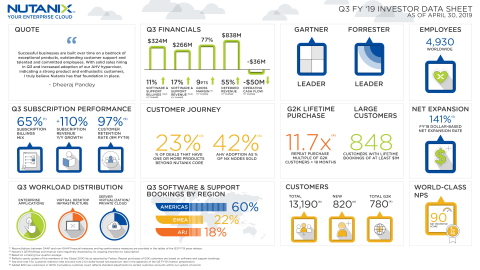
Q3 Fiscal 2019 Financial Highlights
-
Revenue: $287.6 million (at 77.1% non-GAAP gross margin), down
from $289.4 million (at 68.4% non-GAAP gross margin) in the third
quarter of fiscal 2018 -
Billings: $346.0 million, down from $351.2 million in the third
quarter of fiscal 2018 -
Software and Support Revenue: $265.8 million, up 17%
year-over-year from $226.8 million in the third quarter of fiscal 2018 -
Software and Support Billings: $324.2 million, up 11%
year-over-year from $292.0 million in the third quarter of fiscal 2018 -
Gross Margin: GAAP gross margin of 73.9%, up from 67.0% in the
third quarter of fiscal 2018; Non-GAAP gross margin of 77.1%, up from
68.4% in the third quarter of fiscal 2018 -
Net Loss: GAAP net loss of $209.8 million, compared to a GAAP
net loss of $85.7 million in the third quarter of fiscal 2018;
Non-GAAP net loss of $103.0 million, compared to a non-GAAP net loss
of $34.6 million in the third quarter of fiscal 2018 -
Net Loss Per Share: GAAP net loss per share of $1.15, compared
to a GAAP net loss per share of $0.51 in the third quarter of fiscal
2018; Non-GAAP net loss per share of $0.56, compared to a non-GAAP net
loss per share of $0.21 in the third quarter of fiscal 2018 -
Cash and Short-term Investments: $940.8 million, up from $923.5
million in the third quarter of fiscal 2018 -
Deferred Revenue: $838.3 million, up 55% from the third quarter
of fiscal 2018 -
Operating Cash Flow: Use of $36.5 million, compared to
generation of $13.3 million in the third quarter of fiscal 2018 -
Free Cash Flow: Use of $58.9 million, compared to use of $0.8
million in the third quarter of fiscal 2018
Reconciliations between GAAP and non-GAAP financial measures and key
performance measures are provided in the tables of this press release.
“While we faced a top-line impact in our third quarter as we continue to
execute our strategic shift toward a recurring revenue business model,
our strong foundation and commitment to our customers position us well
for the long term,” said Dheeraj Pandey, Chairman, Founder and CEO of
Nutanix. “Successful businesses are built over time on a bedrock of
exceptional products, outstanding customer support and talented and
committed employees. With solid sales hiring in Q3 and increased
adoption of our AHV hypervisor, indicating a strong product and
enthusiastic customers, I truly believe Nutanix has that foundation in
place.”
“We are encouraged by the momentum and growth of our subscription
business as we transform to a recurring revenue model, which will enable
a more predictable revenue stream over time and provide our customers
greater flexibility for their hybrid cloud deployments,” said Duston
Williams, CFO of Nutanix. “We believe the actions we have been taking to
strengthen lead generation and enhance sales execution will position us
well for the future.”
Recent Company Highlights
-
Accelerated Our Shift to Subscription Recurring Revenue Model: Q3
FY’19 subscription billings increased to 65% of total billings, up 8
percentage points from the previous quarter, and Q3 FY’19 subscription
revenue reached $168.4 million, representing a year-over-year increase
of 110%. Nutanix signed a deal worth nearly $6 million with a new
customer, which is one of the global Big Four accounting firms. This
deal represents the largest subscription deal in company history with
a new customer. -
Expanded Customer Base: Nutanix ended the third quarter of
fiscal 2019 with 13,190 end-customers. Third quarter customer wins
included Cyxtera Technologies, Lessor Group, Los Angeles County Museum
of Art, Meredith Corporation, Tokyo Stock Exchange, Inc., Unum Group,
Whole Foods Market and more. -
Signed Global
Agreement with HPE: Nutanix entered an agreement with
HPE, the world’s second largest server vendor, to deliver hybrid cloud
as-a-service fueled by Nutanix’s AHV hypervisor and an integrated
appliance running Nutanix Enterprise Cloud OS software on HPE servers
to the market. These two joint solutions are expected to be available
in calendar Q3 2019. -
Hosted Eighth .NEXT
User Conference in Anaheim, CA: Nearly 6,000 attendees,
including customers, prospects and partners, joined Nutanix in Anaheim
for the eighth annual .NEXT Conference where attendees heard from
Nutanix customers about transforming their business with the Nutanix
Enterprise Cloud Platform. The venue was also the location for the 3rd
and largest Partner Xchange to date, with 1,600 Nutanix channel
attendees. -
Announced Nutanix
Mine: Nutanix announced a new open solution that integrates
secondary storage operations with the Nutanix Enterprise Cloud
Platform, allowing customers to manage their primary and secondary
storage operations from within the same management plane. Working with
leading backup providers like Veeam, HYCU, Commvault, Veritas and
Unitrends, Nutanix Mine will eliminate the complexity of managing a
separate silo for backup operations while preserving the ability for
customers to use the backup solution that is the best fit for their
business operations. -
Announced Nutanix
Xi Frame on AHV: Nutanix introduced the extension of
its desktop-as-a-service offering to Nutanix-powered private clouds,
expanding its availability beyond the public clouds of AWS and Azure.
With full support for Nutanix AHV, IT teams can now select the right
cloud, public or private, for their VDI initiatives. -
Introduced Nutanix
Xi Clusters: Nutanix announced a
first-of-its-kind hybrid cloud offering that provides true hybridity
and elasticity by delivering the complete Nutanix HCI stack directly
on AWS EC2 bare metal instances. Xi Clusters running in AWS can be
managed by Prism deployed on-premises or on Xi Clusters in AWS. -
Announced Global Availability of Nutanix Enterprise Cloud OS
Software on Fujitsu: Nutanix and Fujitsu, the largest server
vendor in Japan, announced the
global availability of Nutanix Enterprise OS software on Fujitsu’s
PRIMERGY® servers. With this announcement, Nutanix brings greater
choice of hardware platforms to our customers in Japan and around the
world, and once again demonstrates the power of its Enterprise OS
software capabilities. -
Launched The
Forecast by Nutanix: Nutanix introduced a new site
focused on delivering news articles with insights, interviews and tech
trends for its customers, partners, prospects and enterprise cloud
industry at large. -
Added Experienced Cloud Executive to Board of Directors: In a
separate announcement today, Nutanix announced that Brian
Stevens, who recently served as VP and CTO of Google Cloud, is
joining the Nutanix Board of Directors effective June 1, 2019. Brian
also served as EVP and CTO of Red Hat during his 13-year tenure at the
company.
Q4 Fiscal 2019 Financial Outlook
For the fourth quarter of fiscal 2019, Nutanix expects:
- Revenue between $280 million and $310 million;
- Billings between $350 million and $380 million;
- Non-GAAP gross margin of approximately 77%;
- Non-GAAP operating expenses between $340 million and $350 million; and
-
Non-GAAP net loss per share of approximately $0.65, using
approximately 187 million weighted shares outstanding
1Based on a trailing four-quarter average.
Supplementary materials to this earnings release, including the
company’s third quarter fiscal 2019 investor presentation, can be found
at https://ir.nutanix.com/company/financial.
All forward-looking non-GAAP financial measures contained in the section
titled “Q4 Fiscal 2019 Financial Outlook” exclude stock-based
compensation expense and amortization of intangible assets and may also
exclude, as applicable, other special items. The company has not
reconciled guidance for billings, non-GAAP gross margin, non-GAAP
operating expenses and non-GAAP loss per share to their most directly
comparable GAAP measures because such items that impact these measures
are not within its control and are subject to constant change. While the
actual amounts of such items will have a significant impact on the
company’s billings, non-GAAP gross margin, non-GAAP operating expenses
and non-GAAP loss per share, a reconciliation of the non-GAAP financial
measure guidance to the corresponding GAAP measures is not available
without unreasonable effort.
Webcast and Conference Call Information
Nutanix executives will discuss the company’s third quarter fiscal 2019
financial results on a conference call at 4:30 p.m. Eastern Time/1:30
p.m. Pacific Time today. To listen to the call via telephone, dial
1-833-227-5841 in the United States or 1-647-689-4068 from outside the
United States. The conference ID is 8889111. This call will be webcast
live and available to all interested parties on our Investor Relations
website at ir.nutanix.com.
Shortly after the conclusion of the conference call, a replay of the
audio webcast will be available on the Nutanix Investor Relations
website. A telephonic replay will be available for one week by calling
1-800-585-8367 or 1-416-621-4642, and entering the conference ID 8889111.
Non-GAAP Financial Measures and Other Key Performance Measures
To supplement our condensed consolidated financial statements, which are
prepared and presented in accordance with GAAP, we use the following
non-GAAP financial and other key performance measures: billings,
non-GAAP gross margin, non-GAAP operating expenses, non-GAAP net loss,
non-GAAP net loss per share, free cash flow, software and support
revenue, subscription revenue, software and support billings, and
subscription and professional services billings. In computing these
non-GAAP financial measures and key performance measures, we exclude
certain items such as stock-based compensation and the related income
tax impact, costs associated with our acquisitions (such as amortization
of acquired intangible assets, revaluation of contingent consideration,
income tax-related impact, and other acquisition-related costs),
amortization of debt discount and issuance costs, other non-recurring
transactions and the related tax impact, and the revenue and billings
associated with pass-through hardware sales. Billings is a performance
measure which our management believes provides useful information to
investors because it represents the amounts under binding purchase
orders received by us during a given period that have been billed, and
we calculate billings by adding the change in deferred revenue between
the start and end of the period to total revenue recognized in the same
period. Free cash flow is a performance measure that our management
believes provides useful information to management and investors about
the amount of cash generated by the business after necessary capital
expenditures, and we define free cash flow as net cash (used in)
provided by operating activities less purchases of property and
equipment. Non-GAAP gross margin, non-GAAP operating expenses, non-GAAP
net loss, and non-GAAP net loss per share are financial measures which
our management believes provide useful information to investors because
they provide meaningful supplemental information regarding our
performance and liquidity by excluding certain expenses and expenditures
such as stock-based compensation expense that may not be indicative of
our ongoing core business operating results. Software and support
revenue and software and support billings are performance measures that
our management believes provide useful information to our management and
investors as it allows us to better track the true growth of our
software business by excluding the amounts attributable to the
pass-through hardware sales that we use to deliver our solutions.
Subscription revenue, subscription billings, and professional services
billings are performance measures that our management believes provide
useful information to our management and investors as it allows us to
better track the growth of the subscription-based portion of our
business, which is a critical part of our business plan. We use these
non-GAAP financial and key performance measures for financial and
operational decision-making and as a means to evaluate period-to-period
comparisons. However, these non-GAAP financial and key performance
measures have limitations as analytical tools and you should not
consider them in isolation or as substitutes for analysis of our results
as reported under GAAP. Billings, non-GAAP gross margin, non-GAAP
operating expenses, non-GAAP net loss, non-GAAP net loss per share, and
free cash flow are not substitutes for total revenue, gross margin,
operating expenses, net loss, net loss per share, or net cash (used in)
provided by operating activities, respectively, software and support
revenue and software and support billings are not substitutes for total
revenue, and subscription and professional services billings are not a
substitute for subscription and professional services revenue. In
addition, other companies, including companies in our industry, may
calculate non-GAAP financial measures and key performance measures
differently or may use other measures to evaluate their performance, all
of which could reduce the usefulness of our non-GAAP financial measures
and key performance measures as tools for comparison. We urge you to
review the reconciliation of our non-GAAP financial measures and key
performance measures to the most directly comparable GAAP financial
measures included below in the tables captioned “Reconciliation of
Revenue to Billings,” “Disaggregation of Revenue and Billings,”
“Reconciliation of Subscription and Professional Services Revenue to
Subscription and Professional Services Billings,” “Reconciliation of
Software and Support Revenue to Software and Support Billings,”
“Reconciliation of GAAP to Non-GAAP Profit Measures,” and
“Reconciliation of GAAP Net Cash Provided By Operating Activities to
Non-GAAP Free Cash Flow,” and not to rely on any single financial
measure to evaluate our business.
Forward-Looking Statements
This press release contains express and implied forward-looking
statements, including, but not limited to, statements regarding our
business plans and objectives, the benefits and capabilities of our
platform, products, services and technology, our plans and expectations
regarding new products, services, product features and technology that
are under development or in process, our continued investment in talent,
technology, and marketing, our plans and timing for, and the success and
impact of, our transition to a subscription-based and recurring revenue
business model, any impact of the actions we have undertaken to
strengthen lead generation and enhance sales execution, and anticipated
future financial results, including but not limited to our guidance on
estimated revenues, billings, non-GAAP gross margin, non-GAAP operating
expenses and non-GAAP net loss per share for future fiscal periods.
These forward-looking statements are not historical facts and instead
are based on our current expectations, estimates, opinions, and beliefs.
Consequently, you should not rely on these forward-looking statements.
The accuracy of such forward-looking statements depends upon future
events and involves risks, uncertainties, and other factors beyond our
control that may cause these statements to be inaccurate and cause our
actual results, performance or achievements to differ materially and
adversely from those anticipated or implied by such statements,
including, among others: failure to develop, or unexpected difficulties
or delays in developing, new products, services, product features or
technology in a timely or cost-effective basis; delays in or lack of
customer or market acceptance of our new products, services, product
features or technology; delays in the transition to a subscription-based
and recurring revenue business model; failure of the actions we have
undertaken to strengthen lead generation and enhance sales execution;
the rapid evolution of the markets in which we compete; our ability to
sustain or manage future growth effectively; factors that could result
in the significant fluctuation of our future quarterly operating
results, including, among other things, anticipated changes to our
revenue and product mix which will slow revenue growth during such
transition and make forecasting future performance more difficult, the
timing and magnitude of orders, shipments and acceptance of our
solutions in any given quarter, our ability to attract new and retain
existing end-customers, changes in the pricing of certain components of
our solutions, and fluctuations in demand and competitive pricing
pressures for our solutions; the introduction, or acceleration of
adoption of, competing solutions, including public cloud infrastructure;
and other risks detailed in our quarterly report on Form 10-Q for the
fiscal quarter ended January 31, 2019, filed with the SEC on March 12,
2019. Additional information will also be set forth in our Form 10-Q
that will be filed for the quarter ended April 30, 2019, which should be
read in conjunction with these financial results. Our SEC filings are
available on the Investor Relations section of the company’s website at ir.nutanix.com
and on the SEC’s website at www.sec.gov.
These forward-looking statements speak only as of the date of this press
release and, except as required by law, we assume no obligation to
update forward-looking statements to reflect actual results or
subsequent events or circumstances.
About Nutanix
Nutanix is a global leader in cloud software and hyperconverged
infrastructure solutions, making infrastructure invisible so that IT can
focus on the applications and services that power their business.
Companies around the world use Nutanix Enterprise Cloud OS platform to
bring one-click application management and mobility across public,
private and distributed edge clouds so they can run any application at
any scale with a dramatically lower total cost of ownership. The result
is organizations that can rapidly deliver a high-performance IT
environment on demand, giving application owners a true cloud-like
experience. Learn more at www.nutanix.com
or follow us on Twitter @nutanix.
© 2019 Nutanix, Inc. All rights reserved. Nutanix, the Nutanix logo,
Nutanix Era, and all product and service names mentioned herein are
registered trademarks or trademarks of Nutanix, Inc. in the United
States and other countries. All other brand names mentioned herein are
for identification purposes only and may be the trademarks of their
respective holder(s).
| NUTANIX, INC. | ||||||||
| CONDENSED CONSOLIDATED BALANCE SHEETS | ||||||||
| (Unaudited) | ||||||||
| As of | ||||||||
| July 31, | April 30, | |||||||
| 2018 | 2019 | |||||||
| (in thousands) | ||||||||
| Assets | ||||||||
| Current assets: | ||||||||
| Cash and cash equivalents | $ | 305,975 | $ | 445,119 | ||||
| Short-term investments | 628,328 | 495,633 | ||||||
| Accounts receivable, net | 258,289 | 244,445 | ||||||
| Deferred commissions—current | 33,691 | 40,309 | ||||||
| Prepaid expenses and other current assets | 36,818 | 73,744 | ||||||
|
Total current assets |
1,263,101 | 1,299,250 | ||||||
| Property and equipment, net | 85,111 | 134,562 | ||||||
| Deferred commissions—non-current | 80,688 | 98,889 | ||||||
| Intangible assets, net | 45,366 | 71,118 | ||||||
| Goodwill | 87,759 | 185,180 | ||||||
| Other assets—non-current | 37,855 | 12,820 | ||||||
| Total assets | $ | 1,599,880 | $ | 1,801,819 | ||||
| Liabilities and Stockholders’ Equity | ||||||||
| Current liabilities: | ||||||||
| Accounts payable | $ | 65,503 | $ | 82,597 | ||||
| Accrued compensation and benefits | 85,398 | 75,032 | ||||||
| Accrued expenses and other current liabilities | 31,682 | 20,019 | ||||||
| Deferred revenue—current | 275,648 | 361,432 | ||||||
| Total current liabilities | 458,231 | 539,080 | ||||||
| Deferred revenue—non-current | 355,559 | 476,830 | ||||||
| Convertible senior notes, net | 429,598 | 451,399 | ||||||
| Other liabilities—non-current | 29,713 | 29,064 | ||||||
| Total liabilities | 1,273,101 | 1,496,373 | ||||||
| Stockholders’ equity: | ||||||||
| Common stock | 4 | 5 | ||||||
| Additional paid-in capital | 1,355,907 | 1,760,083 | ||||||
| Accumulated other comprehensive (loss) income | (1,002 | ) | 329 | |||||
| Accumulated deficit | (1,028,130 | ) | (1,454,971 | ) | ||||
|
Total stockholders’ equity |
326,779 | 305,446 | ||||||
| Total liabilities and stockholders’ equity | $ | 1,599,880 | $ | 1,801,819 | ||||
| NUTANIX, INC. | ||||||||||||||||
| CONDENSED CONSOLIDATED STATEMENTS OF OPERATIONS | ||||||||||||||||
| (Unaudited) | ||||||||||||||||
| Three Months Ended | Nine Months Ended | |||||||||||||||
| April 30, | April 30, | |||||||||||||||
| 2018 | 2019 | 2018 | 2019 | |||||||||||||
| (in thousands, except share and per share data) | ||||||||||||||||
| Revenue: | ||||||||||||||||
| Product | $ | 221,117 | $ | 184,794 | $ | 663,339 | $ | 646,072 | ||||||||
| Support, entitlements and other services | 68,296 | 102,830 | 188,370 | 290,195 | ||||||||||||
| Total revenue | 289,413 | 287,624 | 851,709 | 936,267 | ||||||||||||
| Cost of revenue: | ||||||||||||||||
| Product (1)(2) | 66,680 | 29,528 | 235,059 | 114,755 | ||||||||||||
| Support, entitlements and other services (1) | 28,935 | 45,549 | 77,706 | 120,410 | ||||||||||||
| Total cost of revenue | 95,615 | 75,077 | 312,765 | 235,165 | ||||||||||||
| Gross profit | 193,798 | 212,547 | 538,944 | 701,102 | ||||||||||||
| Operating expenses: | ||||||||||||||||
| Sales and marketing (1)(2) | 169,860 | 245,703 | 466,466 | 655,907 | ||||||||||||
| Research and development (1) | 81,291 | 137,982 | 216,727 | 371,550 | ||||||||||||
| General and administrative (1) | 24,929 | 33,040 | 56,929 | 89,167 | ||||||||||||
| Total operating expenses | 276,080 | 416,725 | 740,122 | 1,116,624 | ||||||||||||
| Loss from operations | (82,282 | ) | (204,178 | ) | (201,178 | ) | (415,522 | ) | ||||||||
| Other expense, net | (4,235 | ) | (3,212 | ) | (5,285 | ) | (10,314 | ) | ||||||||
| Loss before (benefit from) provision for income taxes | (86,517 | ) | (207,390 | ) | (206,463 | ) | (425,836 | ) | ||||||||
| (Benefit from) provision for income taxes | (843 | ) | 2,423 | 3,329 | 1,005 | |||||||||||
| Net loss | $ | (85,674 | ) | $ | (209,813 | ) | $ | (209,792 | ) | $ | (426,841 | ) | ||||
|
Net loss per share attributable to Class A and Class B common stockholders—basic and diluted |
$ | (0.51 | ) | $ | (1.15 | ) | $ | (1.30 | ) | $ | (2.38 | ) | ||||
|
Weighted average shares used in computing net loss per share attributable to Class A and Class B common stockholders—basic and diluted |
166,845,544 | 182,962,921 | 161,709,365 | 179,235,498 | ||||||||||||
|
_____________________ |
||
| (1) | Includes the following stock-based compensation expense: | |
| Three Months Ended | Nine Months Ended | ||||||||||||||
| April 30, | April 30, | ||||||||||||||
| 2018 | 2019 | 2018 | 2019 | ||||||||||||
| (in thousands) | |||||||||||||||
| Product cost of revenue | $ | 634 | $ | 953 | $ | 1,888 | $ | 2,523 | |||||||
| Support, entitlements and other services cost of revenue | 1,951 | 4,542 | 6,156 | 11,072 | |||||||||||
| Sales and marketing | 18,051 | 35,257 | 47,759 | 81,325 | |||||||||||
| Research and development | 16,474 | 42,265 | 49,039 | 107,953 | |||||||||||
| General and administrative | 7,836 | 11,815 | 17,630 | 30,449 | |||||||||||
| Total stock-based compensation expense | $ | 44,946 | $ | 94,832 | $ | 122,472 | $ | 233,322 | |||||||
|
_____________________ |
||
| (2) | Includes the following amortization of intangible assets: | |
| Three Months Ended | Nine Months Ended | ||||||||||||||
| April 30, | April 30, | ||||||||||||||
| 2018 | 2019 | 2018 | 2019 | ||||||||||||
| (in thousands) | |||||||||||||||
| Product cost of sales | $ | 1,447 | $ | 3,694 | $ | 3,506 | $ | 10,554 | |||||||
| Sales and marketing | 222 | 661 | 625 | 1,877 | |||||||||||
| Total amortization of intangible assets | $ | 1,669 | $ | 4,355 | $ | 4,131 | $ | 12,431 | |||||||
|
NUTANIX, INC. |
||||||||
|
CONDENSED CONSOLIDATED STATEMENTS OF CASH FLOWS |
||||||||
|
(Unaudited) |
||||||||
| Nine Months Ended | ||||||||
| April 30, | ||||||||
| 2018 | 2019 | |||||||
| (in thousands) | ||||||||
| Cash flows from operating activities: | ||||||||
| Net loss | $ | (209,792 | ) | $ | (426,841 | ) | ||
|
Adjustments to reconcile net loss to net cash provided by operating activities: |
||||||||
| Depreciation and amortization | 36,013 | 55,740 | ||||||
| Stock-based compensation | 122,472 | 233,322 | ||||||
| Amortization of debt discount and debt issuance costs | 7,654 | 21,802 | ||||||
| Change in fair value of contingent consideration | (3,371 | ) | (832 | ) | ||||
| Other | (186 | ) | (1,837 | ) | ||||
| Changes in operating assets and liabilities: | ||||||||
| Accounts receivable, net | (15,307 | ) | 16,734 | |||||
| Deferred commissions | (29,201 | ) | (24,819 | ) | ||||
| Prepaid expenses and other assets (1) | (5,333 | ) | (5,095 | ) | ||||
| Accounts payable | (6,407 | ) | 18,461 | |||||
| Accrued compensation and benefits | 3,700 | (10,366 | ) | |||||
| Accrued expenses and other liabilities | (1,147 | ) | (31,180 | ) | ||||
| Deferred revenue | 170,709 | 206,735 | ||||||
| Net cash provided by operating activities (1) | 69,804 | 51,824 | ||||||
| Cash flows from investing activities: | ||||||||
| Maturities of investments | 147,868 | 460,563 | ||||||
| Purchases of investments | (485,777 | ) | (324,581 | ) | ||||
| Purchases of property and equipment | (46,089 | ) | (94,815 | ) | ||||
| Payments for acquisitions, net of cash and restricted cash acquired | (22,792 | ) | (19,017 | ) | ||||
| Net cash (used in) provided by investing activities | (406,790 | ) | 22,150 | |||||
| Cash flows from financing activities: | ||||||||
|
Proceeds from sales of shares through employee equity incentive plans, net of repurchases |
68,186 | 67,277 | ||||||
| Payment of contingent consideration associated with acquisitions | — | (1,040 | ) | |||||
| Payment of debt in conjunction with acquisitions | (1,428 | ) | (991 | ) | ||||
| Proceeds from issuance of convertible senior notes, net | 563,937 | (75 | ) | |||||
| Proceeds from issuance of warrants | 87,975 | — | ||||||
| Payments for the cost of convertible note hedges | (143,175 | ) | — | |||||
| Payment of offering costs | (85 | ) | — | |||||
| Net cash provided by financing activities | 575,410 | 65,171 | ||||||
| Net increase in cash, cash equivalents and restricted cash (1) | $ | 238,424 | $ | 139,145 | ||||
| Cash, cash equivalents and restricted cash—beginning of period (1) | 139,497 | 307,098 | ||||||
| Cash, cash equivalents and restricted cash—end of period (1) | $ | 377,921 | $ | 446,243 | ||||
| Restricted cash (1) (2) | 1,132 | 1,124 | ||||||
| Cash and cash equivalents—end of period | $ | 376,789 | $ | 445,119 | ||||
| Supplemental disclosures of cash flow information: | ||||||||
| Cash paid for income taxes | $ | 8,038 | $ | 26,731 | ||||
|
Supplemental disclosures of non-cash investing and financing information: |
||||||||
| Issuance of common stock for acquisitions | $ | 63,780 | $ | 103,305 | ||||
|
Purchases of property and equipment included in accounts payable and accrued liabilities |
$ | 9,285 | $ | 11,671 | ||||
| Vesting of early exercised stock options | $ | 570 | $ | 157 | ||||
|
Convertible notes issuance costs included in accounts payable and accrued liabilities |
$ | 425 | $ | — | ||||
|
_____________________ |
||
| (1) |
During the first quarter of fiscal 2019, we adopted Accounting Standards Update (ASU) No. 2016-18, which requires that the statement of cash flows explain the change during the period in the total of cash, cash equivalents and restricted cash. We adopted the standard retrospectively for the prior period presented. Our adoption of ASU 2016-18 did not have any significant impact on our consolidated statement of cash flows. |
|
| (2) |
Included within other assets—non-current in the condensed consolidated balance sheets. |
|
| Reconciliation of Revenue to Billings | |||||||||||||||
| (Unaudited) | |||||||||||||||
|
|
|||||||||||||||
| Three Months Ended | Nine Months Ended | ||||||||||||||
| April 30, | April 30, | ||||||||||||||
| 2018 | 2019 | 2018 | 2019 | ||||||||||||
| (in thousands) | |||||||||||||||
| Total revenue | $ | 289,413 | $ | 287,624 | $ | 851,709 | $ | 936,267 | |||||||
| Change in deferred revenue, net of acquisitions (1) | 61,765 | 58,403 | 170,709 | 206,735 | |||||||||||
| Total billings | $ | 351,178 | $ | 346,027 | $ | 1,022,418 | $ | 1,143,002 | |||||||
|
_____________________ |
||
| (1) |
Amount for the nine months ended April 30, 2019 excludes approximately $0.3 million of deferred revenue assumed in the Frame acquisition. |
|
| Disaggregation of Revenue and Billings | |||||||||||||||
| (Unaudited) | |||||||||||||||
| Three Months Ended | Nine Months Ended | ||||||||||||||
| April 30, | April 30, | ||||||||||||||
| 2018 | 2019 | 2018 | 2019 | ||||||||||||
| (in thousands) | |||||||||||||||
| Disaggregation of Revenue: | |||||||||||||||
| Subscription | $ | 80,105 | $ | 168,447 | $ | 216,668 | $ | 452,779 | |||||||
| Non-portable software | 140,879 | 88,719 | 396,986 | 366,910 | |||||||||||
| Hardware | 62,617 | 21,853 | 221,454 | 92,319 | |||||||||||
| Professional services | 5,812 | 8,605 | 16,601 | 24,259 | |||||||||||
| Total revenue | $ | 289,413 | $ | 287,624 | $ | 851,709 | $ | 936,267 | |||||||
| Disaggregation of Billings: | |||||||||||||||
| Subscription | $ | 142,965 | $ | 224,312 | $ | 378,444 | $ | 652,692 | |||||||
| Non-portable software | 139,092 | 88,719 | 396,986 | 366,910 | |||||||||||
| Hardware | 59,226 | 21,853 | 221,451 | 92,319 | |||||||||||
| Professional services | 9,895 | 11,143 | 25,537 | 31,081 | |||||||||||
| Total billings | $ | 351,178 | $ | 346,027 | $ | 1,022,418 | $ | 1,143,002 | |||||||
Subscription — Subscription revenue is generated from the
sales of software entitlement and support subscriptions, separately
purchased software term-based licenses and cloud-based Software as a
Service, or SaaS offerings. We recognize revenue from software
entitlement and support subscriptions and SaaS offerings ratably over
the contractual service period, while revenue from our separately
purchased software term-based licenses is generally recognized upon
transfer of control to the customer, which is when we make the software
available to our customers.
Non-portable software — Non-portable software revenue includes
sales of our software operating system when delivered on a configured to
order appliance by us, or one of our OEM partners. The software licenses
associated with these sales are typically non-portable and have a term
equal to the life of the appliance it is delivered on. Revenue from our
non-portable software products is generally recognized upon transfer of
control to the customer.
Hardware — In transactions where we deliver the hardware
appliance, we consider ourselves to be the principal in the transaction
and we record revenue and costs of goods sold on a gross basis. We
consider the amount allocated to hardware revenue to be equivalent to
the cost of the hardware procured. Hardware revenue is generally
recognized upon transfer of control to the customer.
Professional services — We also sell professional services with
our products. We recognize revenue related to professional services as
they are performed.
|
Reconciliation of Subscription and Professional Services Revenue to Subscription and Professional Services Billings |
|||||||||||||||
| (Unaudited) | |||||||||||||||
| Three Months Ended | Nine Months Ended | ||||||||||||||
| April 30, | April 30, | ||||||||||||||
|
2018 |
2019 |
2018 |
2019 |
||||||||||||
|
(in thousands) |
|||||||||||||||
| Subscription revenue | $ | 80,105 | $ | 168,447 | $ | 216,668 | $ | 452,779 | |||||||
| Change in subscription deferred revenue, net of acquisitions (1) |
62,860 |
55,865 |
161,776 |
199,913 |
|||||||||||
| Subscription billings | $ | 142,965 | $ | 224,312 | $ | 378,444 | $ | 652,692 | |||||||
| Professional services revenue | $ | 5,812 | $ | 8,605 | $ | 16,601 | $ | 24,259 | |||||||
| Change in professional services deferred revenue |
4,083 |
2,538 |
8,936 |
6,822 |
|||||||||||
| Professional services billings | $ | 9,895 | $ | 11,143 | $ | 25,537 | $ | 31,081 | |||||||
|
_____________________ |
||
| (1) |
Amount for the nine months ended April 30, 2019 excludes approximately $0.3 million of deferred revenue assumed in the Frame acquisition. |
|
|
Reconciliation of Software and Support Revenue to Software and Support Billings |
|||||||||||||||
| (Unaudited) | |||||||||||||||
| Three Months Ended | Nine Months Ended | ||||||||||||||
| April 30, | April 30, | ||||||||||||||
| 2018 | 2019 | 2018 | 2019 | ||||||||||||
| (in thousands) | |||||||||||||||
| Software revenue | $ | 158,500 | $ | 162,941 | $ | 441,885 | $ | 553,753 | |||||||
| Hardware revenue | 62,617 | 21,853 | 221,454 | 92,319 | |||||||||||
| Product revenue | 221,117 | 184,794 | 663,339 | 646,072 | |||||||||||
| Support, entitlements and other services revenue | 68,296 | 102,830 | 188,370 | 290,195 | |||||||||||
| Total revenue | $ | 289,413 | $ | 287,624 | $ | 851,709 | $ | 936,267 | |||||||
| Total software and support revenue (2) | $ | 226,796 | $ | 265,771 | $ | 630,255 | $ | 843,948 | |||||||
|
Change in software and support deferred revenue, net of acquisitions (1) (3) |
65,156 | 58,403 | 170,709 | 206,735 | |||||||||||
| Software and support billings (2) | $ | 291,952 | $ | 324,174 | $ | 800,964 | $ | 1,050,683 | |||||||
|
_____________________ |
||
| (1) |
Amount for the nine months ended April 30, 2019 excludes approximately $0.3 million of deferred revenue assumed in the Frame acquisition. |
|
| (2) |
Software and support revenue and billings include software and support, entitlements and other services revenue and billings. |
|
| (3) |
Approximately $3.4 million of hardware was included in deferred revenue as of January 31, 2018. |
|
| Reconciliation of GAAP to Non-GAAP Profit Measures | ||||||||||||||||||||||||||||||
| (Unaudited) | ||||||||||||||||||||||||||||||
| GAAP | Non-GAAP Adjustments | Non-GAAP | ||||||||||||||||||||||||||||
| Three |
Three |
|||||||||||||||||||||||||||||
| Months |
Months |
|||||||||||||||||||||||||||||
| Ended April |
Ended April |
|||||||||||||||||||||||||||||
| 30, 2019 |
(1) |
(2) |
(3) |
(4) |
(5) |
(6) |
30, 2019 |
|||||||||||||||||||||||
| (in thousands, except share and per share data) | ||||||||||||||||||||||||||||||
| Gross profit | $ | 212,547 | $ | 5,495 | $ | 3,694 | $ | — | $ | — | $ | — | $ | — | $ | 221,736 | ||||||||||||||
| Gross margin | 73.9 | % | 1.9 | % | 1.3 | % | — | — | — | — | 77.1 | % | ||||||||||||||||||
| Operating expenses: | ||||||||||||||||||||||||||||||
| Sales and marketing | 245,703 | (35,257 | ) | (661 | ) | — | — | — | — | 209,785 | ||||||||||||||||||||
| Research and development | 137,982 | (42,265 | ) | — | — | — | — | — | 95,717 | |||||||||||||||||||||
| General and administrative | 33,040 | (11,815 | ) | — | (200 | ) | (11 | ) | — | — | 21,014 | |||||||||||||||||||
| Total operating expenses | 416,725 | (89,337 | ) | (661 | ) | (200 | ) | (11 | ) | — | — | 326,516 | ||||||||||||||||||
| Loss from operations | (204,178 | ) | 94,832 | 4,355 | 200 | 11 | — | — | (104,780 | ) | ||||||||||||||||||||
| Net loss | $ | (209,813 | ) | $ | 94,832 | $ | 4,355 | $ | 200 | $ | 11 | $ | 7,387 | $ | 66 | $ | (102,962 | ) | ||||||||||||
| Weighted shares outstanding, basic and diluted | 182,962,921 | 182,962,921 | ||||||||||||||||||||||||||||
| Net loss per share, basic and diluted | $ | (1.15 | ) | $ | 0.52 | $ | 0.03 | $ | — | $ | — | $ | 0.04 | $ | — | $ | (0.56 | ) | ||||||||||||
|
_____________________ |
||
| (1) | Stock-based compensation expense | |
| (2) | Amortization of intangible assets | |
| (3) | Acquisition-related costs | |
| (4) | Other | |
| (5) | Amortization of debt discount and issuance costs | |
| (6) |
Partial release of valuation allowance in connection with an acquisition |
|
| GAAP | Non-GAAP Adjustments | Non-GAAP | |||||||||||||||||||||||||||||||||
| Nine Months | Nine Months | ||||||||||||||||||||||||||||||||||
| Ended April | Ended April | ||||||||||||||||||||||||||||||||||
| 30, 2019 |
(1) |
(2) |
(3) |
(4) |
(5) |
(6) |
(7) |
30, 2019 | |||||||||||||||||||||||||||
|
|
(in thousands, except share and per share data) |
||||||||||||||||||||||||||||||||||
| Gross profit | $ | 701,102 | $ | 13,595 | $ | 10,554 | $ | — | $ | — | $ | — | $ | 163 | $ | — | $ | 725,414 | |||||||||||||||||
| Gross margin |
74.9 |
% |
1.5 | % | 1.1 | % | — | — | — | — | — | 77.5 | % | ||||||||||||||||||||||
| Operating expenses: | |||||||||||||||||||||||||||||||||||
| Sales and marketing | 655,907 | (81,325 | ) | (1,877 | ) | — | — | — | — | — | 572,705 | ||||||||||||||||||||||||
| Research and development | 371,550 | (107,953 | ) | — | — | — | — | — | 263,597 | ||||||||||||||||||||||||||
| General and administrative | 89,167 | (30,449 | ) | (721 | ) | 832 | — | (48 | ) | 58,781 | |||||||||||||||||||||||||
| Total operating expenses | 1,116,624 | (219,727 | ) | (1,877 | ) | (721 | ) | 832 | — | (48 | ) | — | 895,083 | ||||||||||||||||||||||
| Loss from operations | (415,522 | ) | 233,322 | 12,431 | 721 | (832 | ) | — | 211 | — | (169,669 | ) | |||||||||||||||||||||||
| Net loss | $ | (426,841 | ) | $ | 233,322 | $ | 12,431 | $ | 721 | $ | (832 | ) | $ | 21,802 | $ | 211 | $ | (7,838 | ) | $ | (167,024 | ) | |||||||||||||
| Weighted shares outstanding, basic and diluted | 179,235,498 | 179,235,498 | |||||||||||||||||||||||||||||||||
| Net loss per share, basic and diluted | $ | (2.38 | ) | $ |
1.30 |
$ | 0.07 | $ | — | $ | — | $ | 0.12 | $ | — | $ | (0.04 | ) | $ | (0.93 | ) | ||||||||||||||
|
_____________________ |
||
| (1) | Stock-based compensation expense | |
| (2) | Amortization of intangible assets | |
| (3) | Acquisition-related costs | |
| (4) |
Change in fair value of contingent consideration assumed in the PernixData acquisition |
|
| (5) | Amortization of debt discount and issuance costs | |
| (6) | Other | |
| (7) |
Partial release of valuation allowance in connection with an acquisition and tax effect of a change in law |
|
|
|
GAAP |
Non-GAAP Adjustments |
Non-GAAP |
|||||||||||||||||||||||||||||
| Three |
Three |
|||||||||||||||||||||||||||||||
| Months |
Months |
|||||||||||||||||||||||||||||||
| Ended April |
Ended April |
|||||||||||||||||||||||||||||||
| 30, 2018 |
(1) |
(2) |
(3) |
(4) |
(5) |
(6) |
30, 2018 |
|||||||||||||||||||||||||
|
|
(in thousands, except share and per share data) | |||||||||||||||||||||||||||||||
| Gross profit | $ | 193,798 | $ | 2,585 | $ | 1,447 | $ |
— |
$ | — | $ |
— |
$ | — |
$ |
197,830 | ||||||||||||||||
| Gross margin |
|
67.0 | % |
0.9 |
% |
0.5 |
% |
— |
— |
— |
— |
68.4 |
% |
|||||||||||||||||||
| Operating expenses: | ||||||||||||||||||||||||||||||||
| Sales and marketing |
|
169,860 |
(18,051 |
) |
(222 |
) |
— |
— |
— |
— |
151,587 |
|||||||||||||||||||||
| Research and development |
|
81,291 |
(16,474 |
) |
— |
— |
— |
— |
— |
64,817 |
||||||||||||||||||||||
| General and administrative |
|
24,929 |
(7,836 |
) |
— |
(584 |
) |
(515 |
) |
— |
— |
15,994 |
||||||||||||||||||||
| Total operating expenses |
|
276,080 |
(42,361 |
) |
(222 |
) |
(584 |
) |
(515 |
) |
— |
— |
232,398 |
|||||||||||||||||||
| Loss from operations |
|
(82,282 | ) |
44,946 |
1,669 |
584 |
515 |
— |
— |
(34,568 |
) | |||||||||||||||||||||
| Net loss | $ | (85,674 | ) | $ | 44,946 | $ | 1,669 | $ | 584 | $ | 515 | $ | 6,916 | $ | (3,581 | ) | $ | (34,625 | ) | |||||||||||||
| Weighted shares outstanding, basic and diluted |
|
166,845,544 |
|
166,845,544 |
||||||||||||||||||||||||||||
| Net loss per share, basic and diluted | $ | (0.51 | ) | $ | 0.27 | $ | 0.01 | $ | — | $ | — | $ | 0.04 | $ | (0.02 | ) | $ | (0.21 | ) | |||||||||||||
|
_____________________ |
||
| (1) | Stock-based compensation expense | |
| (2) | Amortization of intangible assets | |
| (3) |
Change in fair value of contingent consideration assumed in the PernixData acquisition |
|
| (4) | Acquisition-related costs | |
| (5) | Amortization of debt discount and debt issuance costs | |
| (6) |
Partial release of valuation allowance in connection with acquisitions and income tax effect primarily related to stock-based compensation expense |
|
|
GAAP |
Non-GAAP Adjustments |
Non-GAAP |
|||||||||||||||||||||||||||||||
|
Nine Months |
Nine Months |
||||||||||||||||||||||||||||||||
|
Ended April |
Ended April |
||||||||||||||||||||||||||||||||
|
30, 2018 |
(1) |
(2) |
(3) |
(4) |
(5) |
(6) |
30, 2018 |
||||||||||||||||||||||||||
|
(in thousands, except share and per share data) |
|||||||||||||||||||||||||||||||||
| Gross profit | $ | 538,944 | $ | 8,044 | $ | 3,506 | $ |
— |
$ |
— |
$ |
— |
$ | — | $ | 550,494 | |||||||||||||||||
| Gross margin |
63.3 |
% |
0.9 |
% |
0.4 |
% |
— |
— |
— |
— |
64.6 |
% | |||||||||||||||||||||
| Operating expenses: | |||||||||||||||||||||||||||||||||
| Sales and marketing |
466,466 |
(47,759 |
) |
(625 |
) |
— |
— |
— |
— |
418,082 |
|||||||||||||||||||||||
| Research and development |
216,727 |
(49,039 |
) |
— |
— |
— |
— |
— |
167,688 |
||||||||||||||||||||||||
| General and administrative |
56,929 |
(17,630 |
) |
— |
3,371 |
(1,043 |
) |
— |
— |
41,627 |
|||||||||||||||||||||||
| Total operating expenses |
740,122 |
(114,428 |
) |
(625 |
) |
3,371 |
(1,043 |
) |
|
— |
— |
627,397 |
|||||||||||||||||||||
| Loss from operations |
(201,178 |
) |
122,472 |
4,131 |
(3,371 |
) |
1,043 |
— |
— |
(76,903 |
) | ||||||||||||||||||||||
| Net loss | $ | (209,792 | ) | $ | 122,472 | $ | 4,131 | $ | (3,371 | ) | $ | 1,043 | $ | 7,654 | $ | (4,653 | ) | $ | (82,516 | ) | |||||||||||||
| Weighted shares outstanding, basic and diluted |
161,709,365 |
161,709,365 |
|||||||||||||||||||||||||||||||
| Net loss per share, basic and diluted | $ | (1.30 | ) | $ | 0.76 | $ | 0.02 | $ | (0.02 | ) | $ | 0.01 | $ | 0.05 | $ | (0.03 | ) | $ | (0.51 | ) | |||||||||||||
|
_____________________ |
||
| (1) | Stock-based compensation expense | |
| (2) | Amortization of intangible assets | |
| (3) |
Change in fair value of contingent consideration assumed in the PernixData acquisition |
|
| (4) | Acquisition-related costs | |
| (5) | Amortization of debt discount and debt issuance costs | |
| (6) |
Partial release of valuation allowance in connection with acquisitions and income tax effect primarily related to stock-based compensation expense |
|
|
Reconciliation of GAAP Net Cash Provided by Operating |
||||||||||||||||
|
(Unaudited) |
||||||||||||||||
| Three Months Ended |
Nine Months Ended |
|||||||||||||||
| April 30, |
April 30, |
|||||||||||||||
|
2018 |
2019 |
2018 |
2019 |
|||||||||||||
|
(in thousands) |
||||||||||||||||
| Net cash provided by (used in) operating activities | $ | 13,292 | $ | (36,490 | ) | $ | 69,804 | $ | 51,824 | |||||||
| Purchases of property and equipment |
(14,096 |
) |
(22,432 |
) |
(46,089 |
) |
(94,815 |
) | ||||||||
| Free cash flow | $ | (804 | ) | $ | (58,922 | ) | $ | 23,715 | $ | (42,991 | ) | |||||

View source version on businesswire.com: https://www.businesswire.com/news/home/20190530005740/en/