
HouseCanary, Inc. (“HouseCanary”), a leading provider of residential real estate data and home valuations, today released its latest Market Pulse report, covering 22 listing-derived metrics and comparing data between the week ending July 17, 2020 and the week ending March 13, 2020. The Market Pulse is an ongoing review of proprietary data and insights from HouseCanary’s nationwide platform.
This press release features multimedia. View the full release here: https://www.businesswire.com/news/home/20200722005301/en/
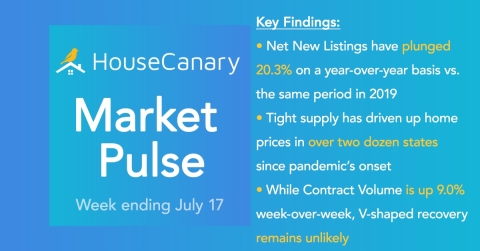
HouseCanary Market Pulse Report (Graphic: Business Wire)
Jeremy Sicklick, Co-founder and Chief Executive Officer of HouseCanary, commented: “It doesn’t bode well for the housing market to see supply and demand fundamentals as skewed as they are right now. A 20.3% year-over-year decline in net new listings has had the short-term benefit of intensifying demand and propping up prices, but a contracting market presents a long-term risk for homeowners that can exacerbate broader economic woes. It appears that sellers in states hit hardest by rising COVID-19 cases are reluctant to list homes and may be avoiding listing altogether until there are some meaningful signs that things are getting better with respect to the pandemic. Given today’s realities, we continue to believe the chances of a V-shaped housing market recovery in 2020 are growing slimmer. There are also potential headwinds on the horizon if the federal government doesn’t sustain the aid needed to help struggling business owners and out-of-work individuals, many of whom have relied on assistance to remain current on mortgage and rent payments in recent months.”
Select findings from this week’s Market Pulse are below. Be sure to review the Market Pulse in full for extensive state-level data, including on states such as California, Florida and Texas – each of which is being impacted by the pandemic’s resurgence.
Total Net New Listings:
- Since the week ending March 13, there have been 1,055,597 net new listings placed on the market, representing a 20.3% decrease relative to the same period in 2019
- For the week ending July 17, there were 54,008 net new listings placed on the market, representing a 4.0% decrease compared to the previous week
-
Percentage of total net new listings since March 13, broken down by home price:
- $0-$200k: 22.6%
- $200k-$400k: 45.0%
- $400k-$600k: 17.6%
- $600k-$1mm: 10.0%
- >$1mm: 4.8%
Weekly New Listing Volume (Single-Family Detached Homes):
- New listing volume is down 1.7% week-over-week
- New listing volume is down 21.9% nationwide compared to the week ending March 13, when most COVID-19 measures were implemented
- New listing volume is up 23.1% from its lowest point in mid-April
-
Decline in new listing activity since the week ending March 13, broken down by home price:
- $0-$200k: (-25.3%)
- $200k-$400k: (-23.8%)
- $400k-$600k: (-20.7%)
- $600k-$1mm: (-14.5%)
- >$1mm: (-12.1%)
Median Listing Price Activity (Single-Family Detached Homes):
- The median price for new listings has risen in 25 states since the start of COVID-19 in March
-
Several states heavily impacted by the pandemic have seen material listing price growth since the onset:
- California (+13%)
- Florida (+7.1%)
- New Jersey (+6.5%)
- Texas (+2.1%)
Weekly Contract Volume (Single-Family Detached Homes):
- Weekly contract volume is up 9.0% week-over-week
-
Percent change in contract volume week-over-week, broken down by home price:
- $0-$200k: +7.0%
- $200k-$400k: +8.4%
- $400k-$600k: +13.2%
- $600k-$1mm: +8.3%
- >$1mm: +10.8%
- Weekly contract volume is up 17.6% nationwide compared to the week ending March 13, when most COVID-19 measures were implemented
- Weekly contract volume is up 83.6% from its lowest level in mid-April
-
Percent change in weekly contract volume since the week ending March 13, broken down by home price:
- $0-$200k: +4.2%
- $200k-$400k: +14.1%
- $400k-$600k: +28.7%
- $600k-$1mm: +39.9%
- >$1mm: +53.0%
Total Listings Under Contract:
- Since the week ending March 13, 1,214,058 properties have gone into contract across 41 states, representing a 3.8% decrease relative to the same period in 2019
- For the week ending July 17, there were 74,578 listings that went under contract nationwide
-
Percentage of total contract volume since the week ending March 13, broken down by home price:
- $0-$200k: 24.9%
- $200k-$400k: 45.4%
- $400k-$600k: 16.8%
- $600k-$1mm: 8.9%
- >$1mm: 4.0%
As a nationwide real estate broker, HouseCanary’s broad multiple listing service (“MLS”) participation allows us to evaluate listing data and aggregate the number of new listings as well as the number of new listings going into contract for all single-family detached homes observed in the HouseCanary database. Using this data, HouseCanary continues to track listing volume, new listings, and median list price for 41 states and 50 individual Metropolitan Statistical Areas (“MSAs”).
About HouseCanary:
Founded in 2013, valuation-focused real estate brokerage HouseCanary provides software and services to reshape the real estate marketplace. Financial institutions, investors, lenders, mortgage investors, and consumers turn to HouseCanary for industry-leading valuations, forecasts, and transaction-support tools. These clients trust HouseCanary to fuel acquisition, underwriting, portfolio management, and more. Learn more at www.housecanary.com.

View source version on businesswire.com: https://www.businesswire.com/news/home/20200722005301/en/